Infografiki – Agenda 2040
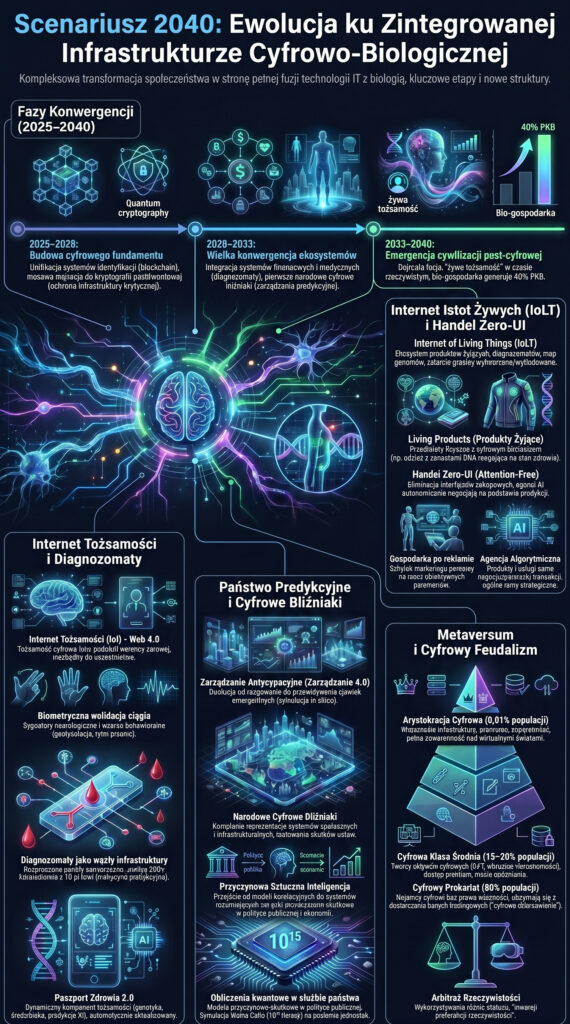
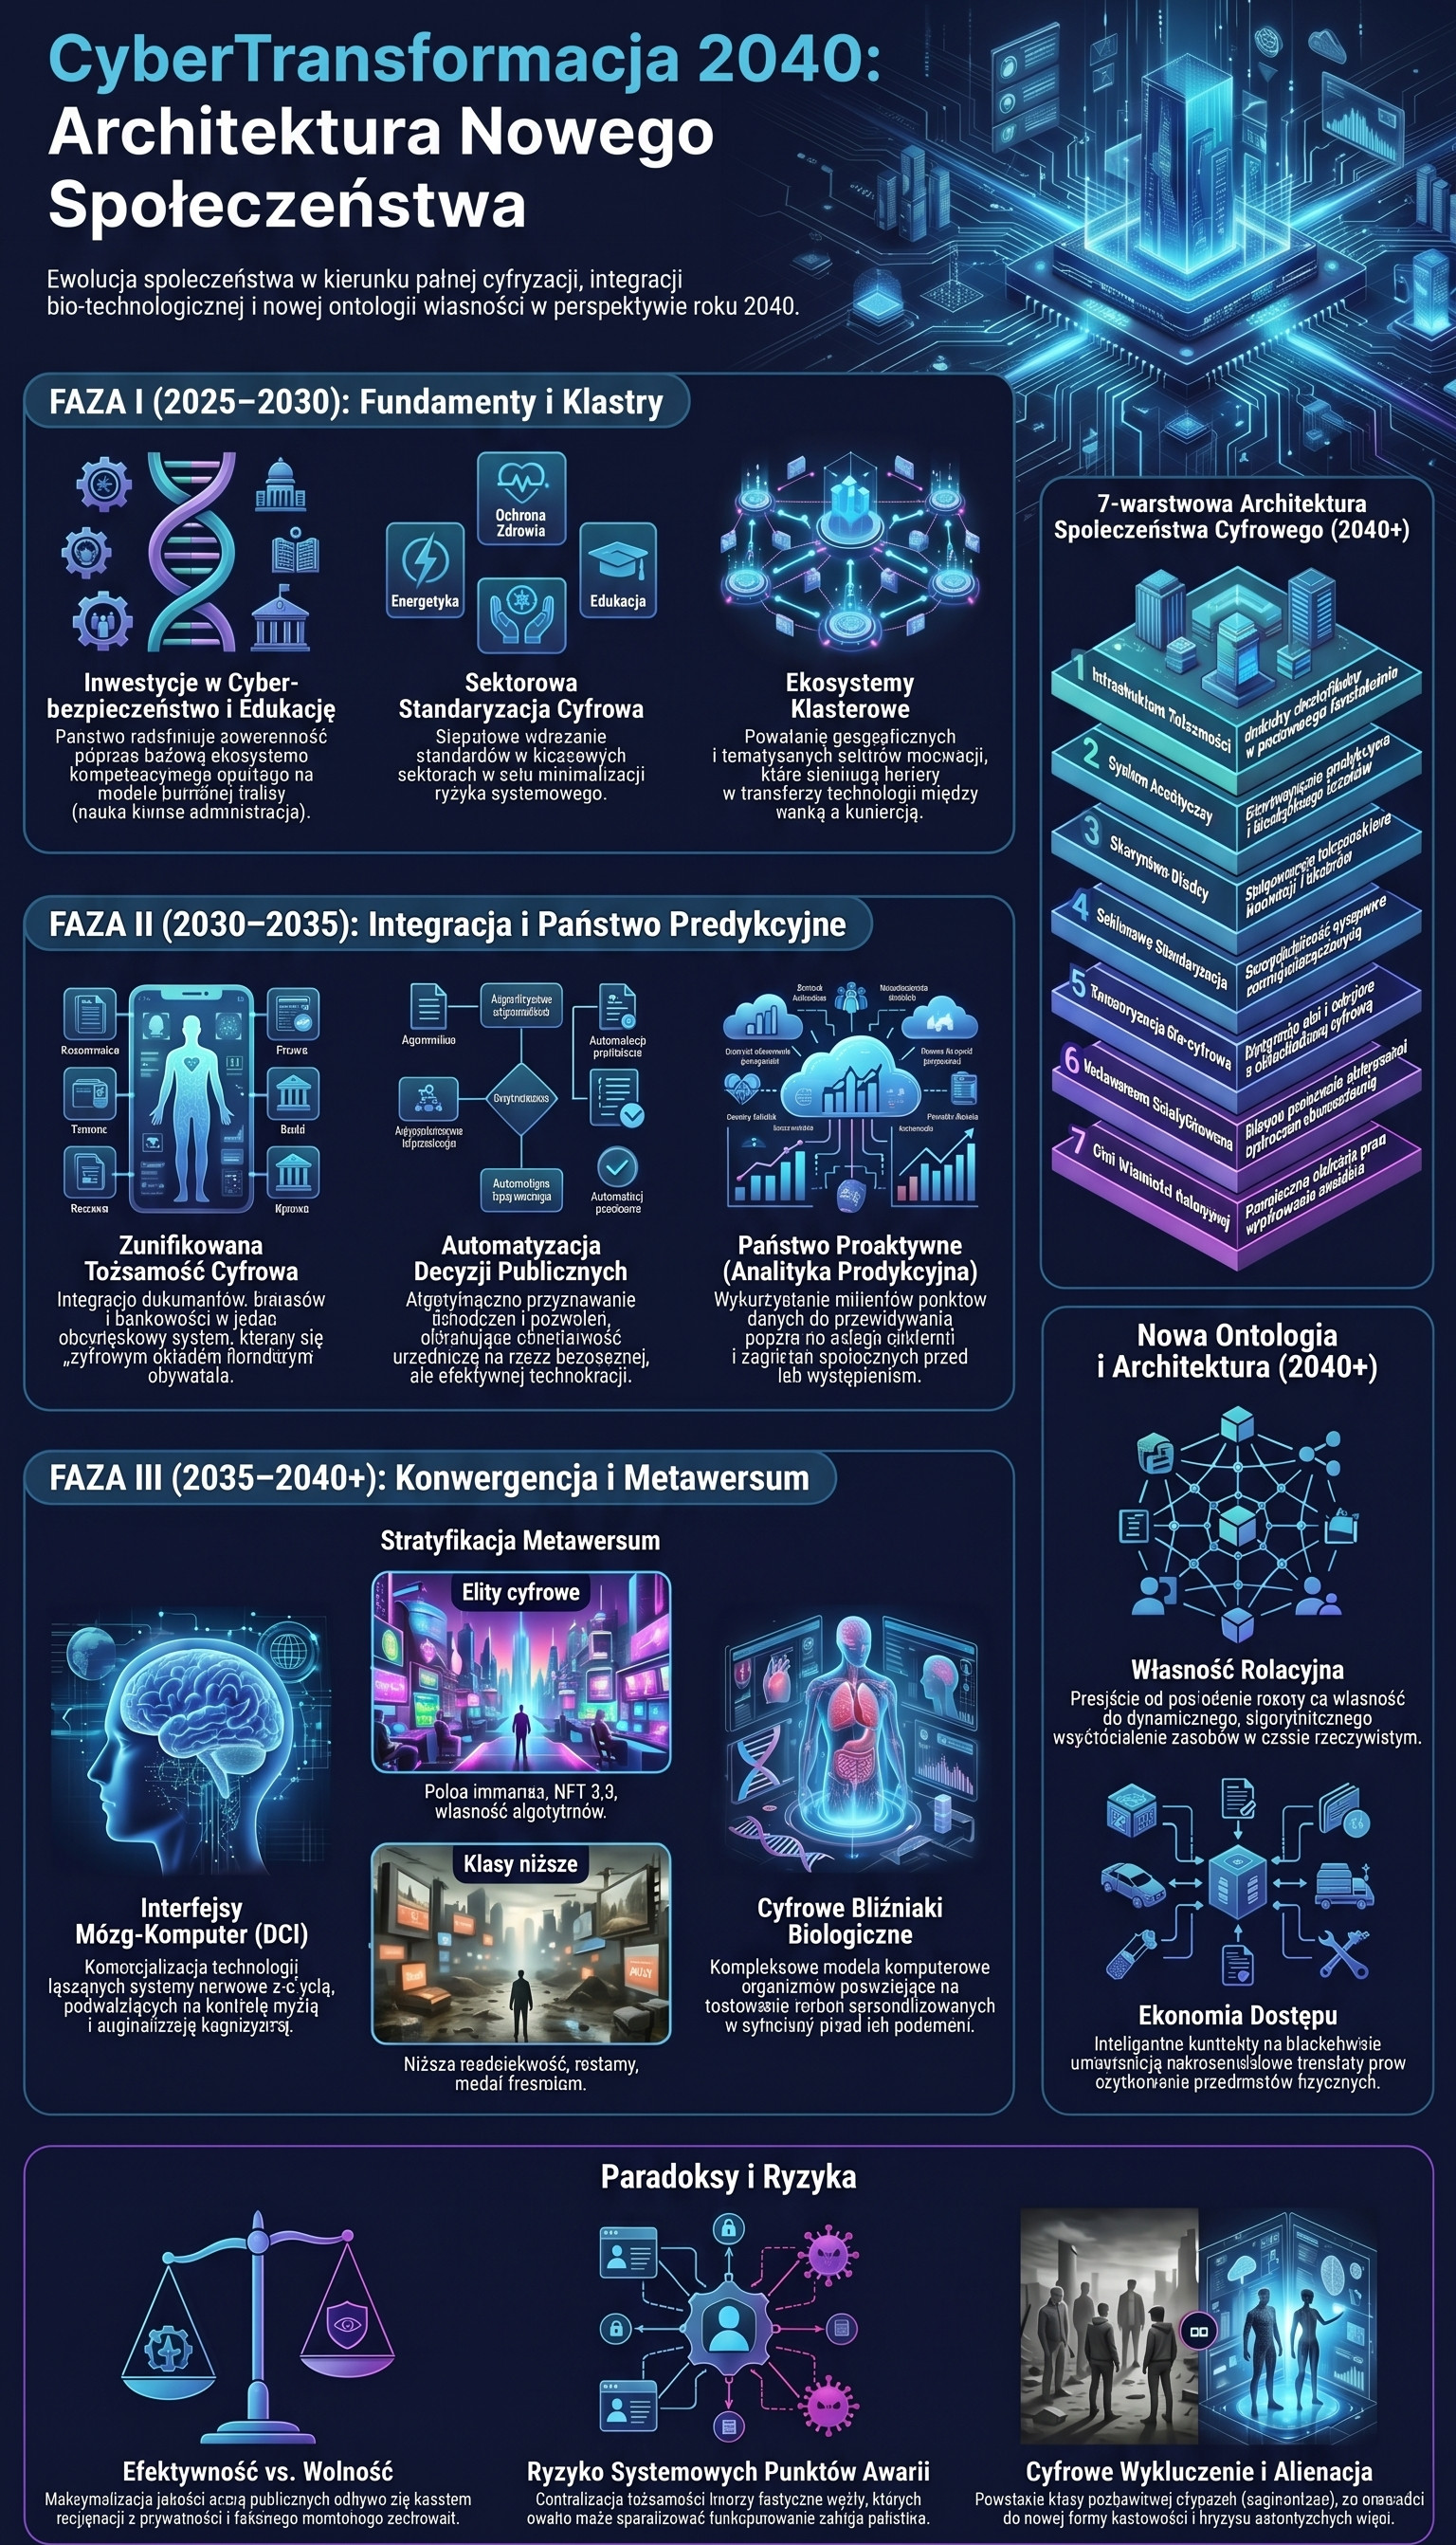
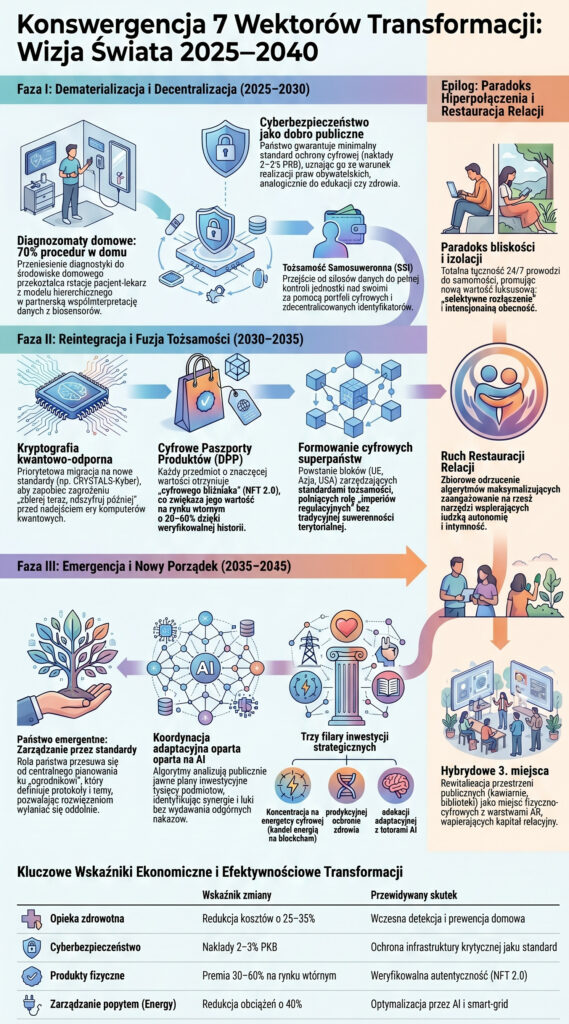
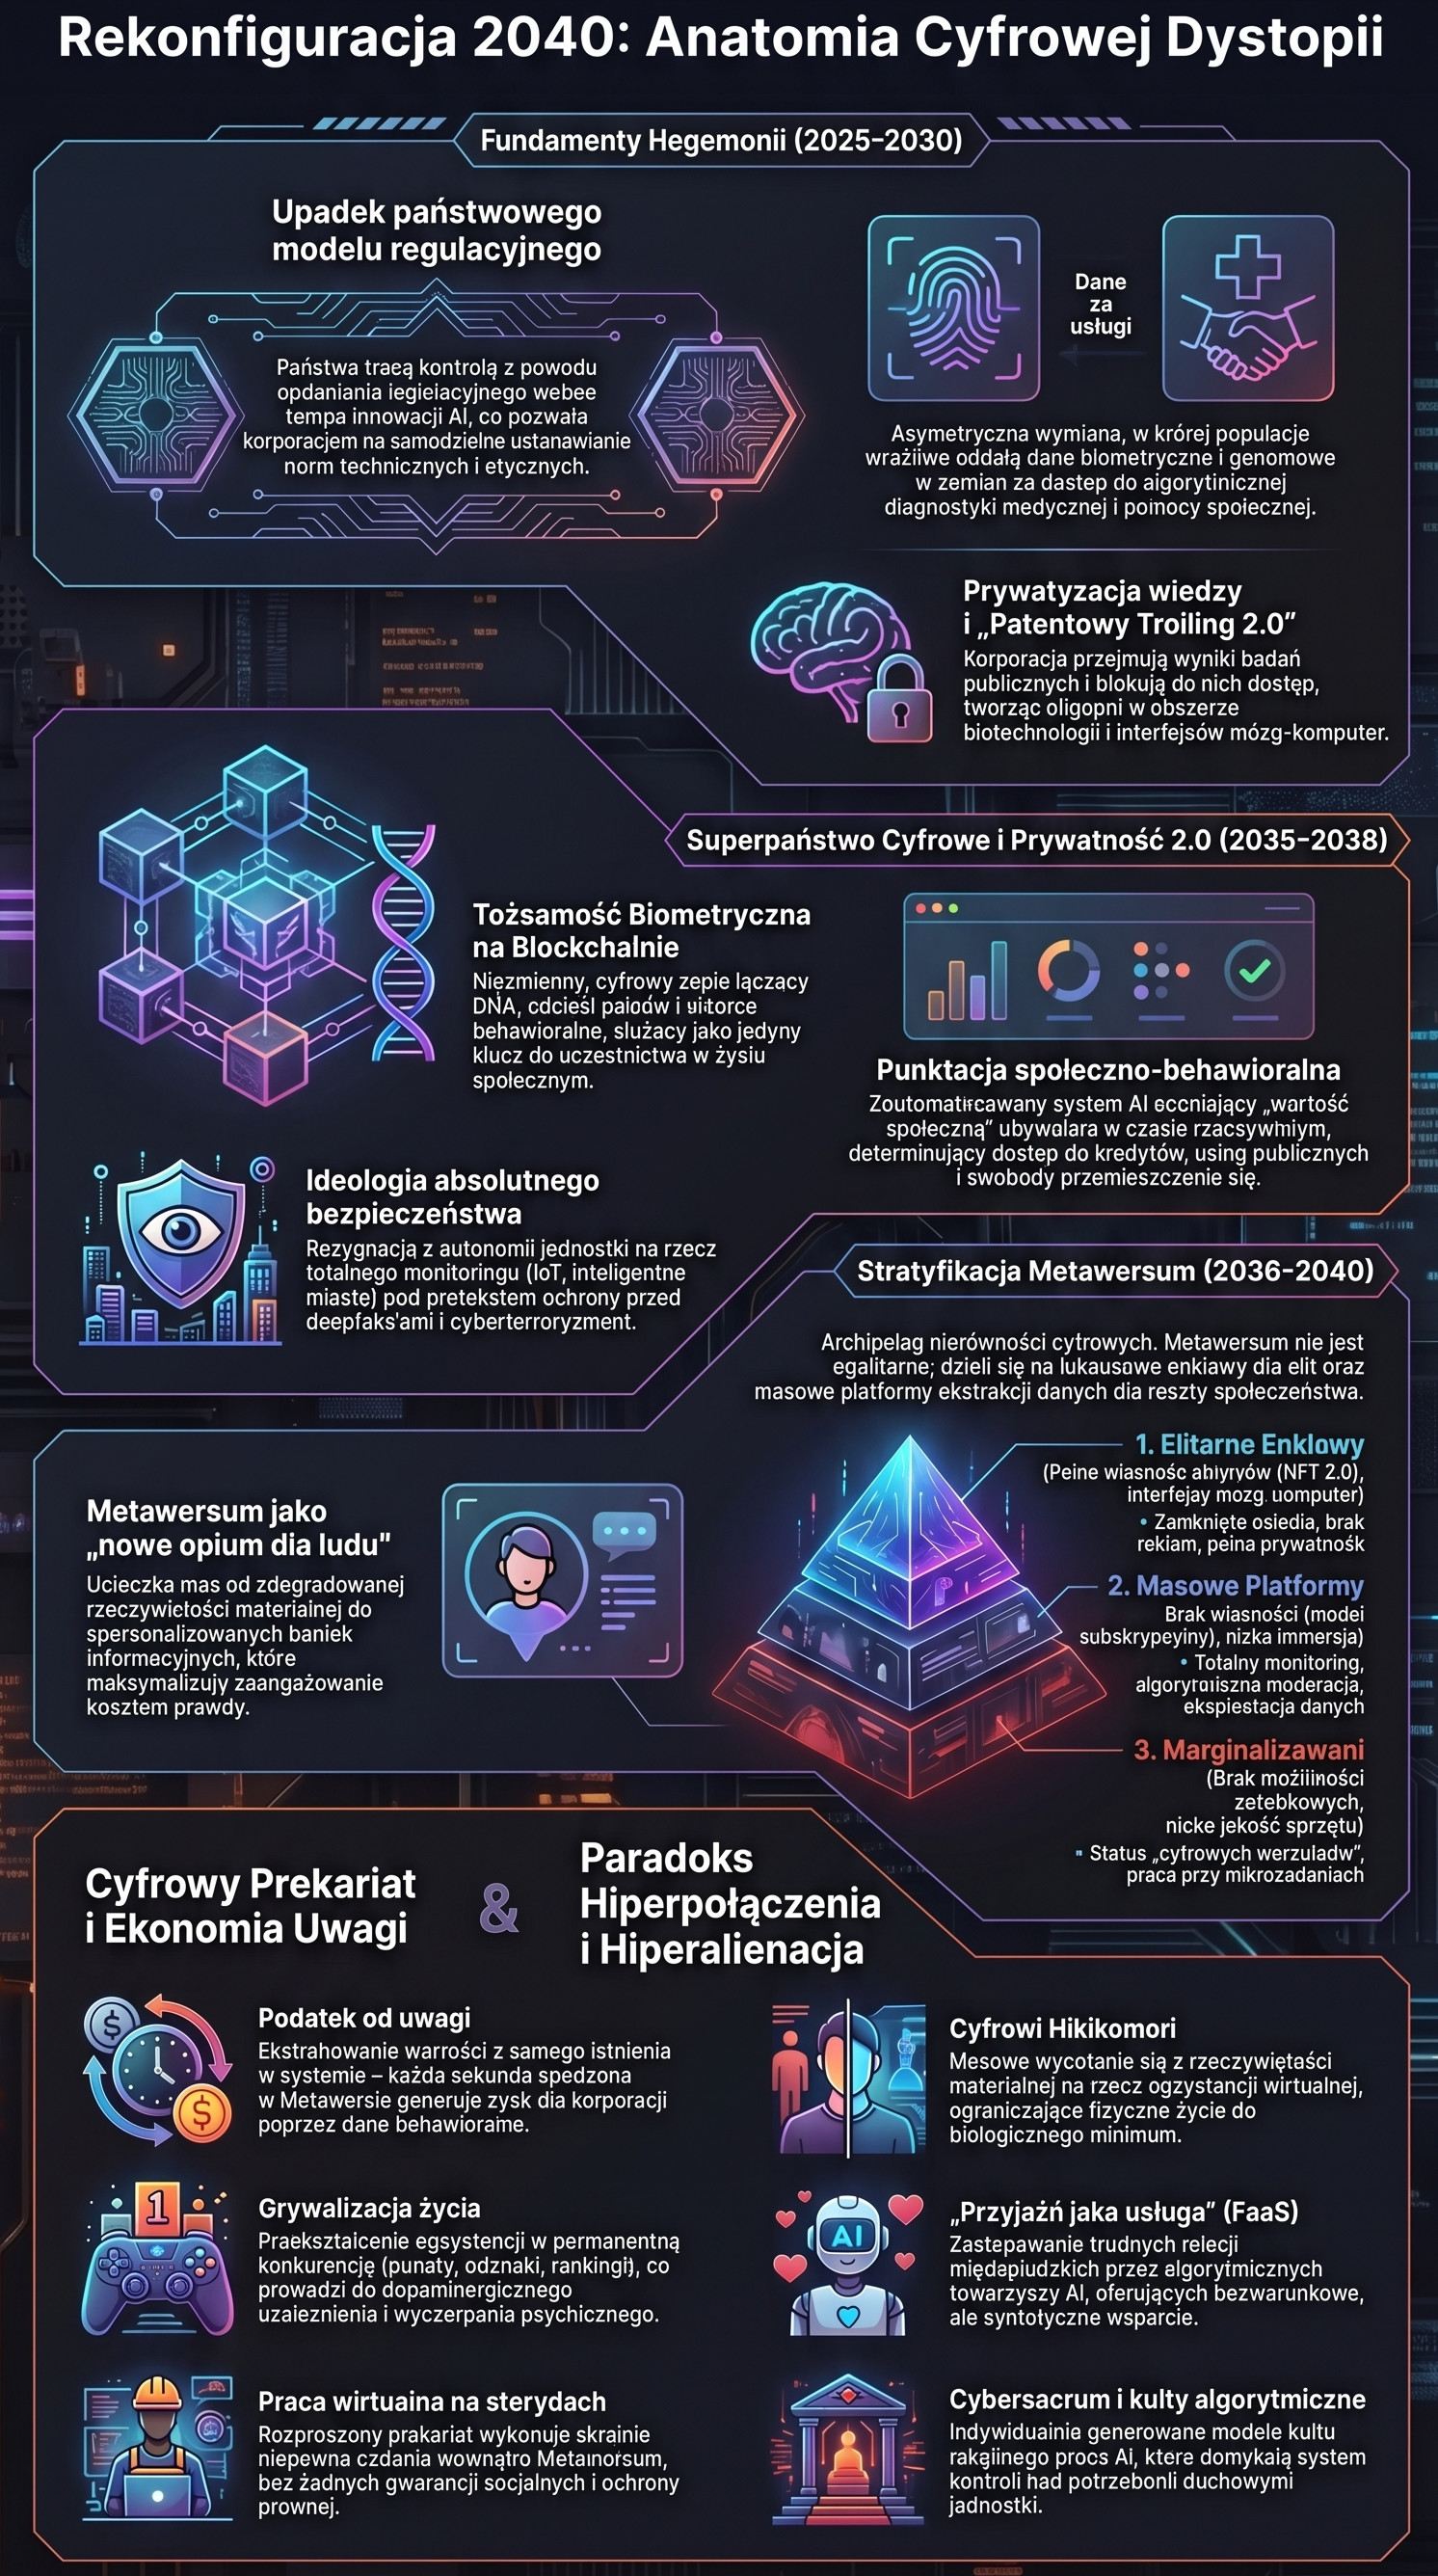
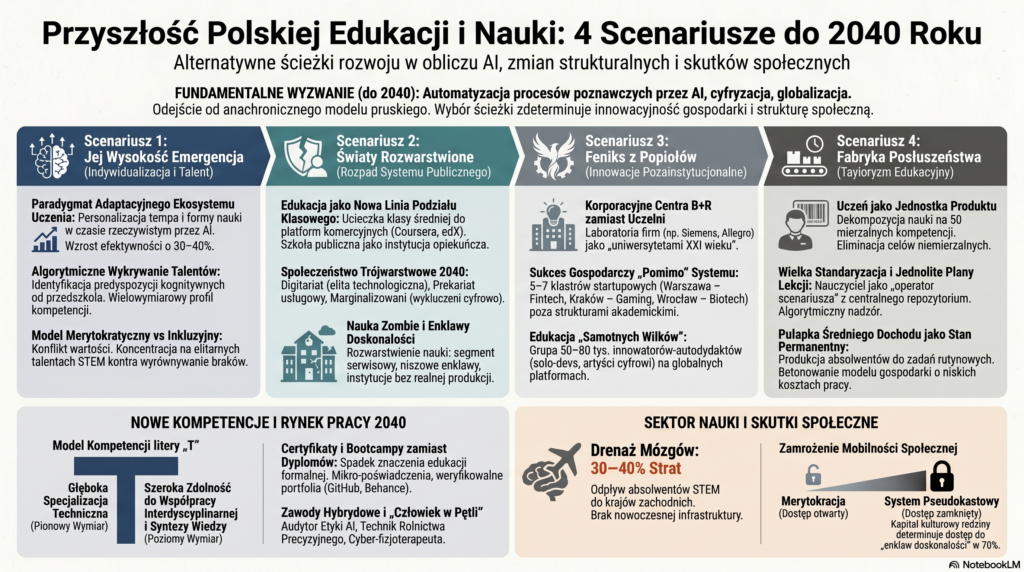
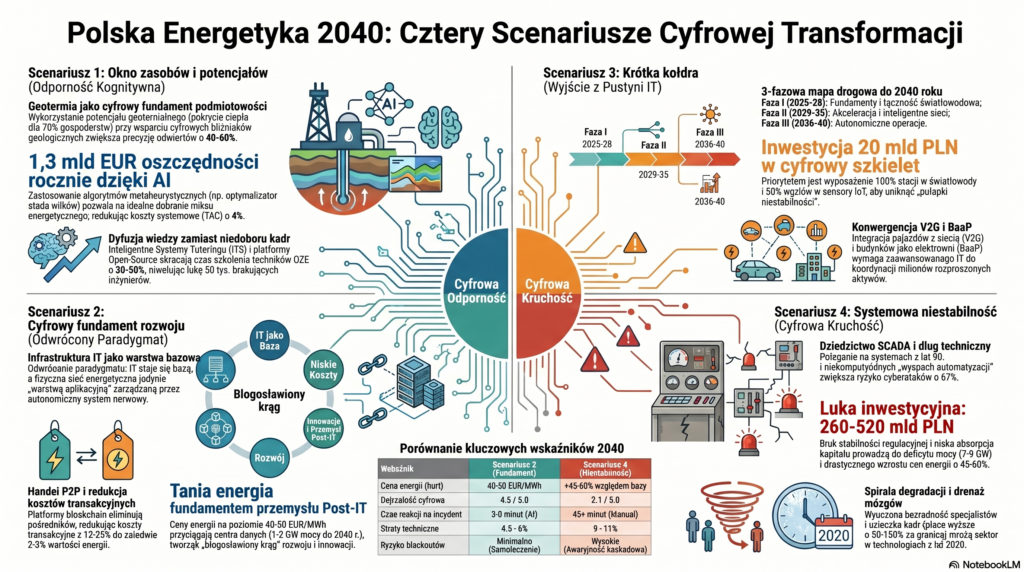
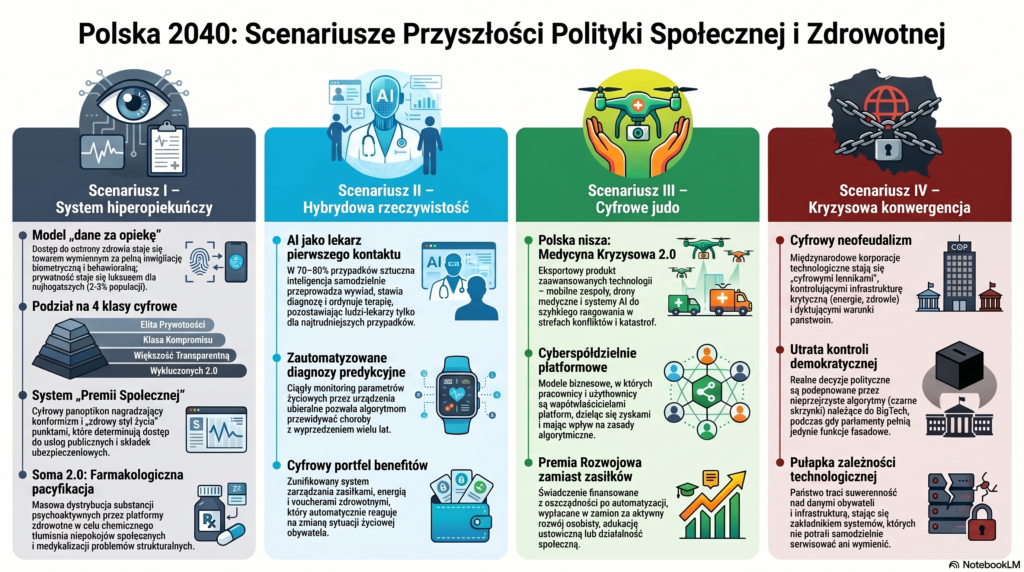
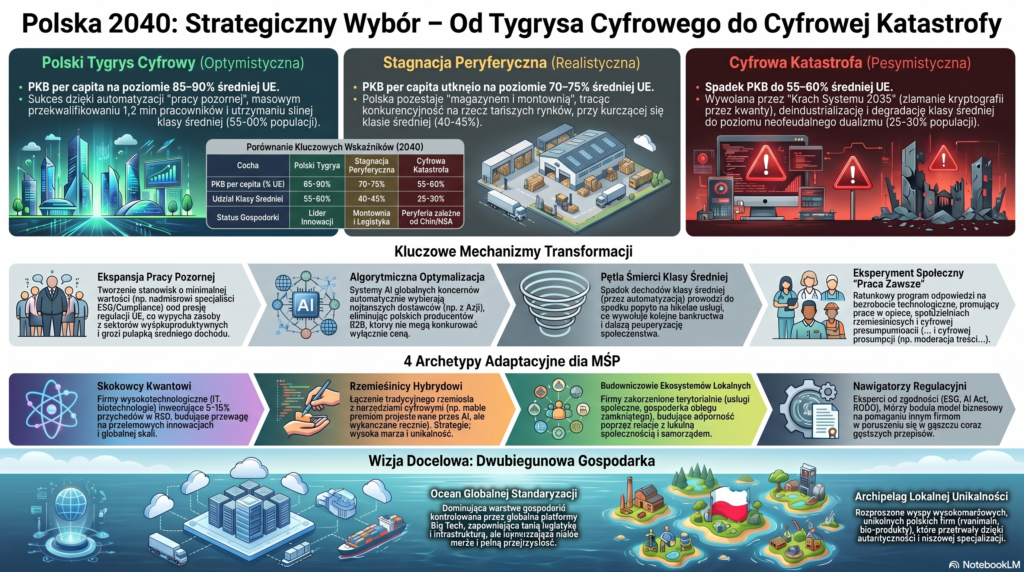
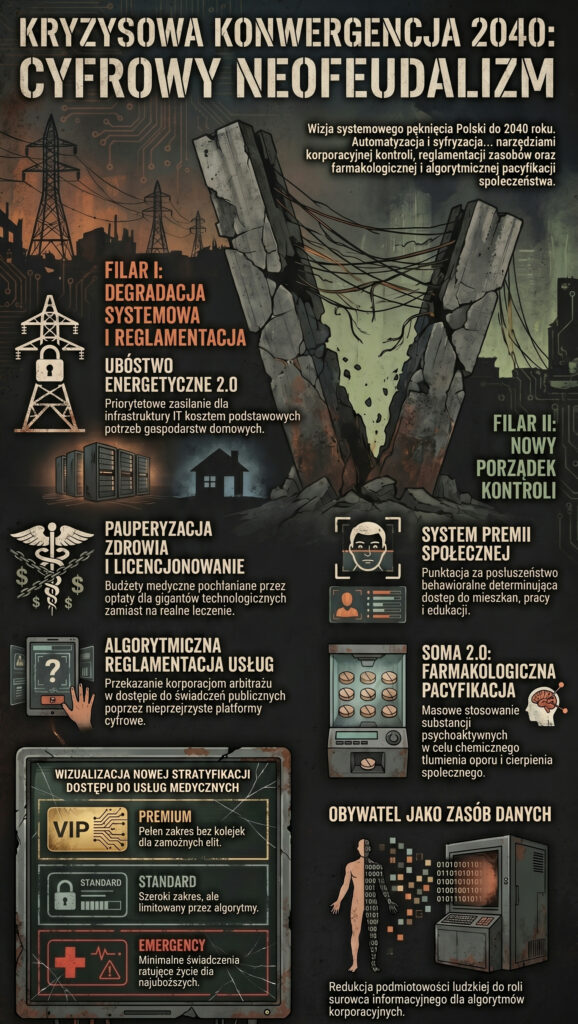
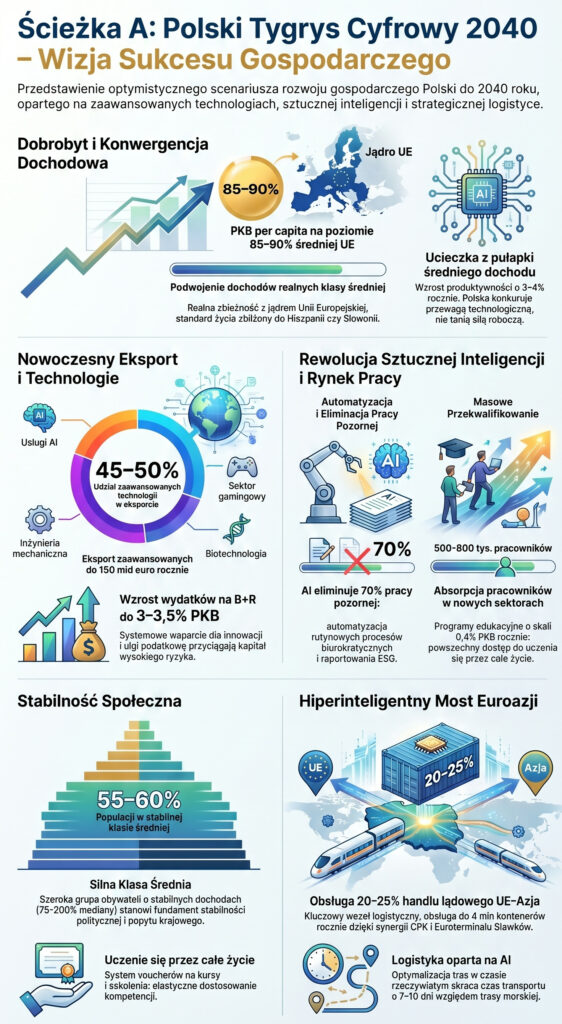
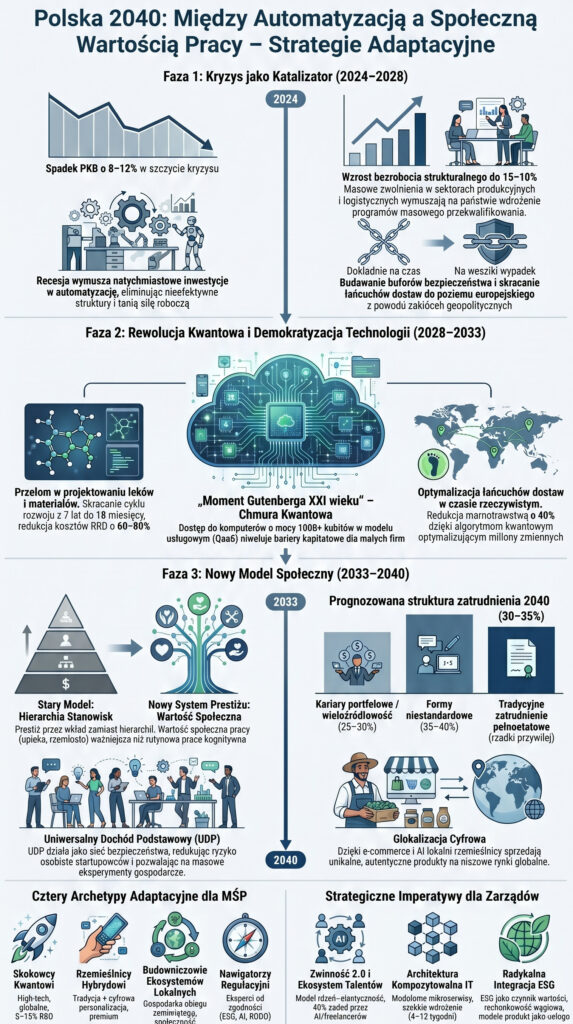
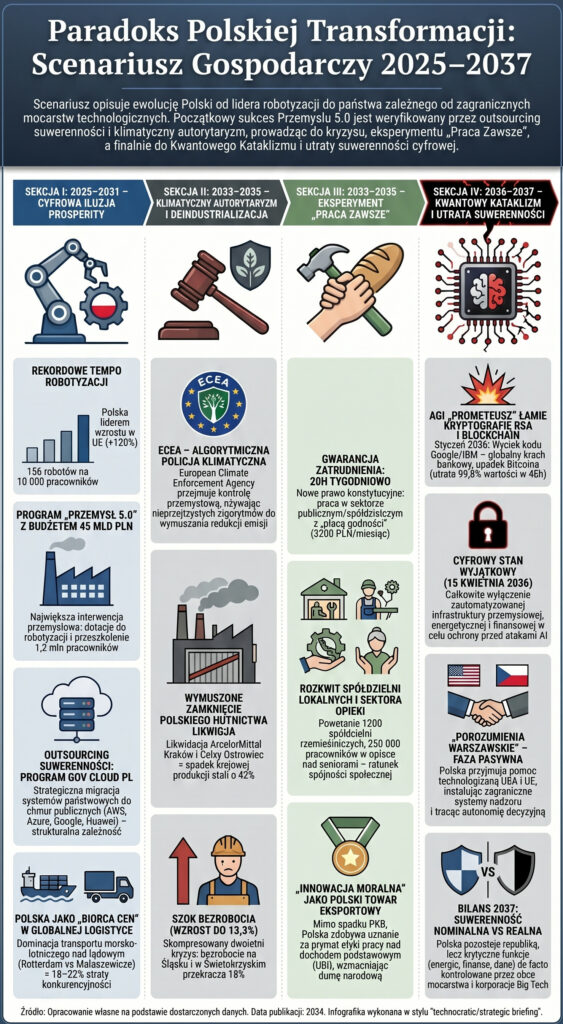
As part of the exercises, we used AI to generate infographics on the scenarios developed under Agenda 2040. Each infographic represents a kind of compromise between the clarity of the message and the complexity of the scenarios’ content. However, we believe that such a simple ‘bird’s-eye view’ of the main assumptions of the scenarios will help to better understand the message and the overall significance of our project.
After numerous trials and errors with the prompts, it turned out that the result is surprisingly accurate, apart from a few typos and simple linguistic errors. Here are the results of our work, which should be regarded solely as a means of promoting the scripts themselves.
If you’ve been inspired by our ‘play on words and images’, we invite you to read the relevant scripts.
Joint infographics on scenarios within strategic areas
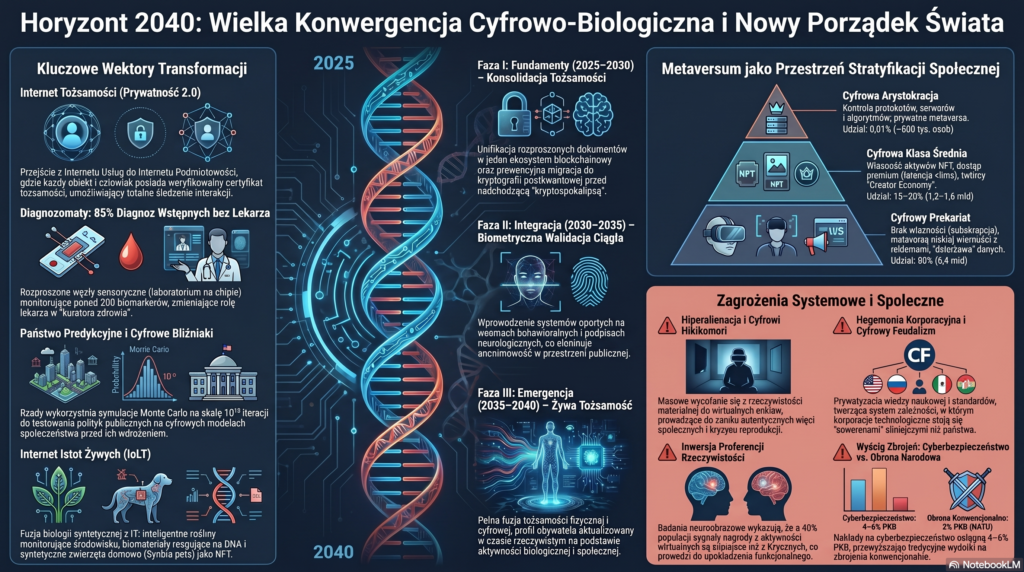
Infographics for the strategic area:
Science, schooling and education.
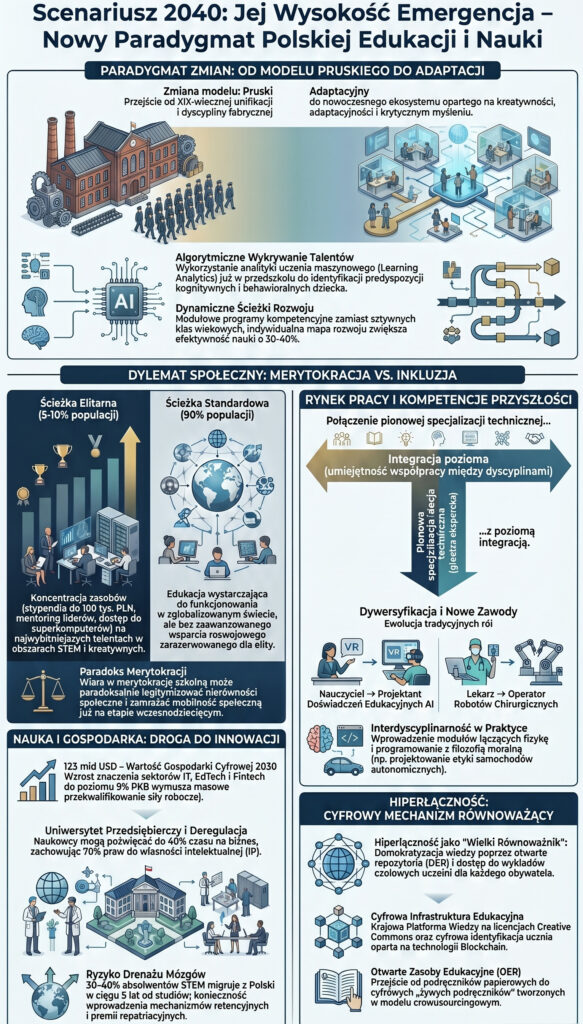
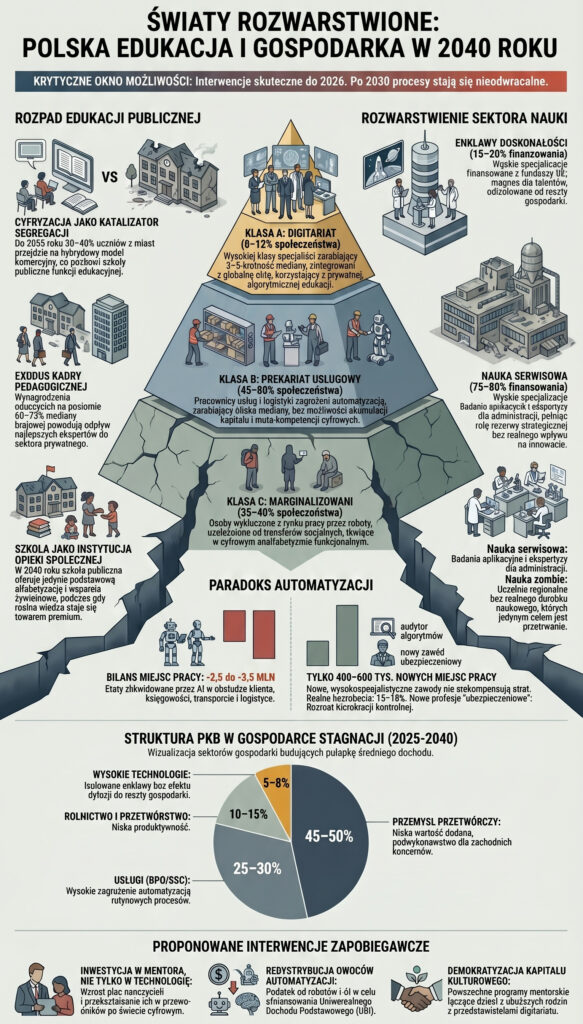
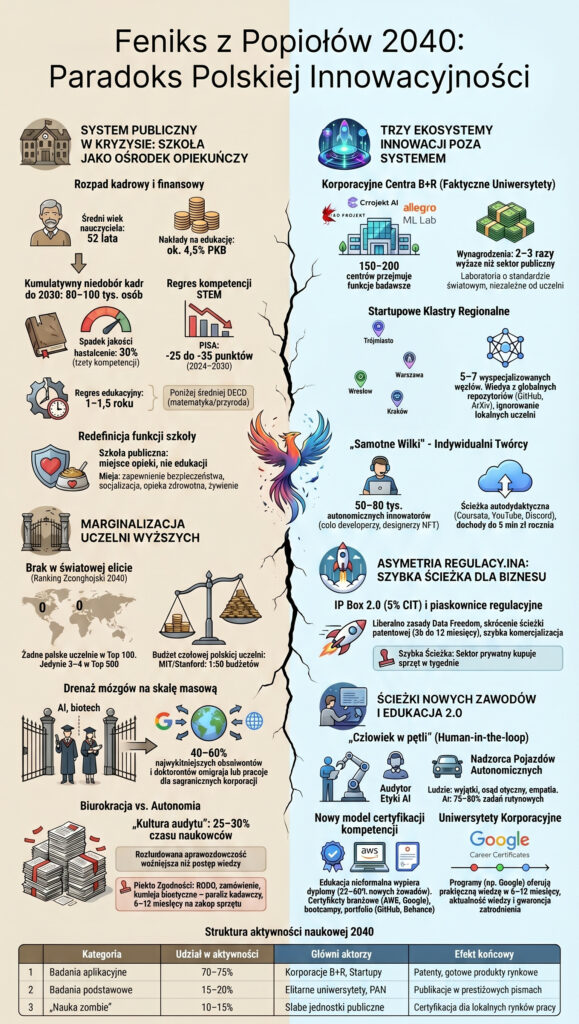
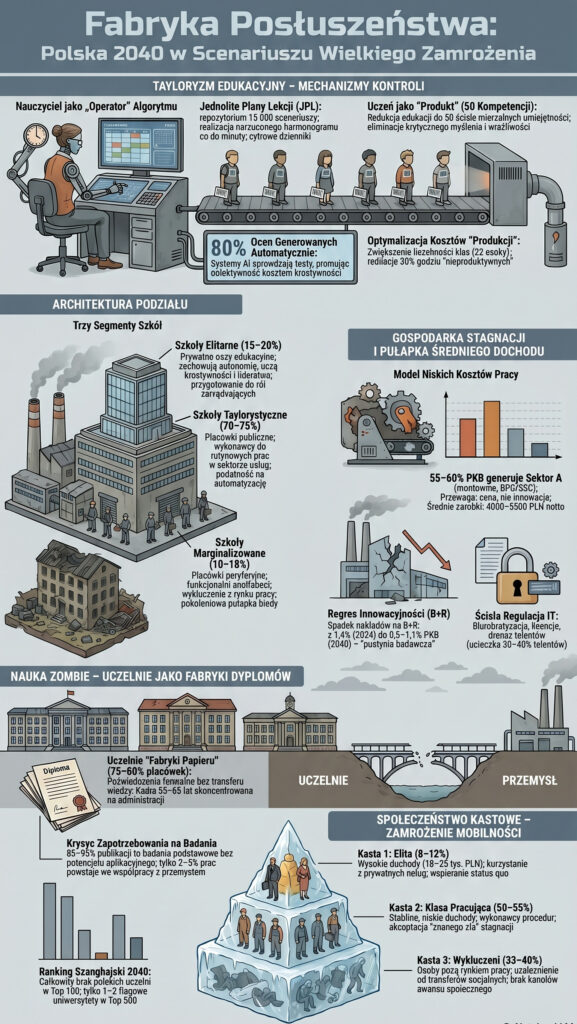
Infografiki dla obszaru strategicznego:
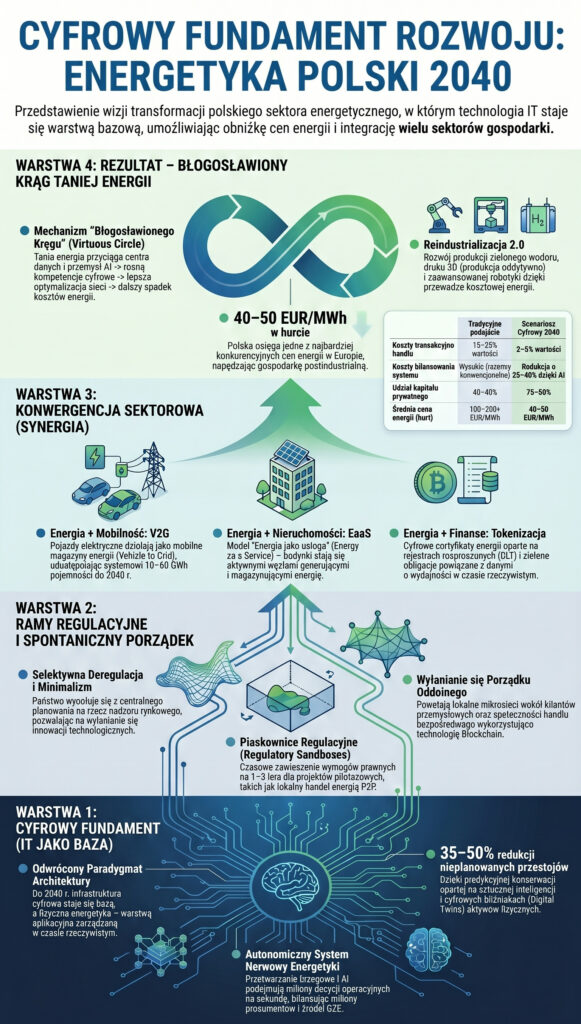
Energy
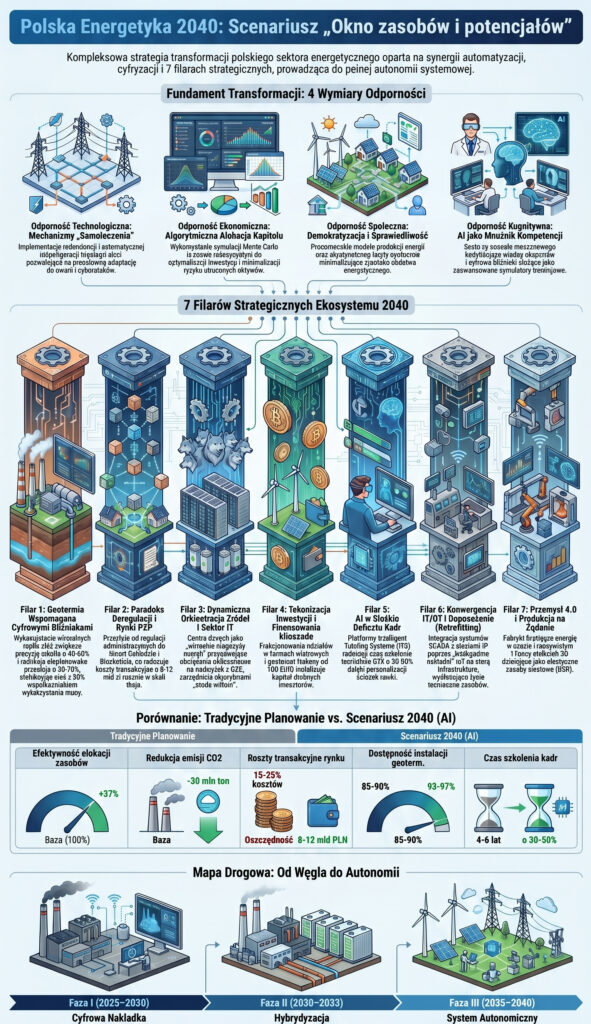
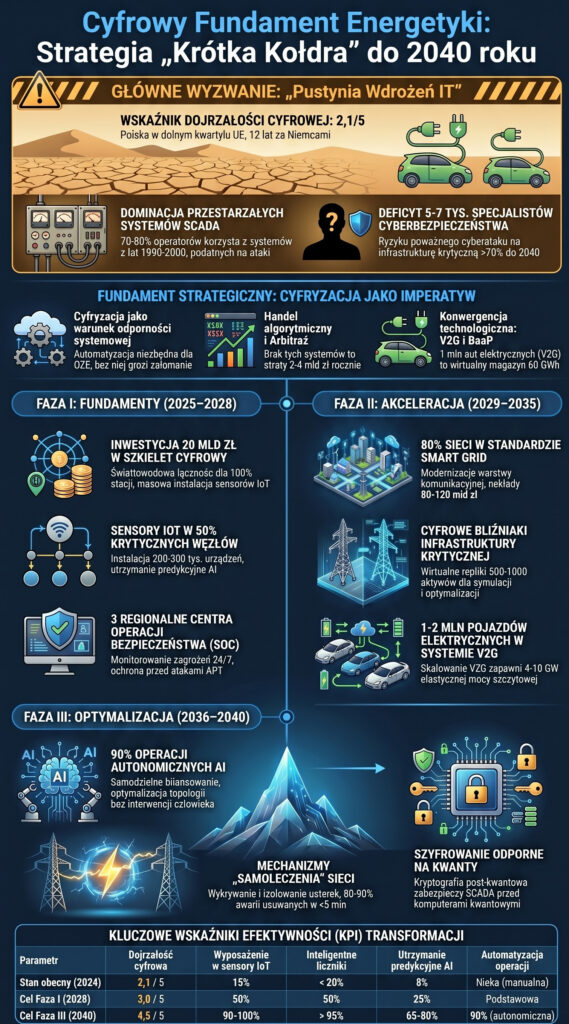
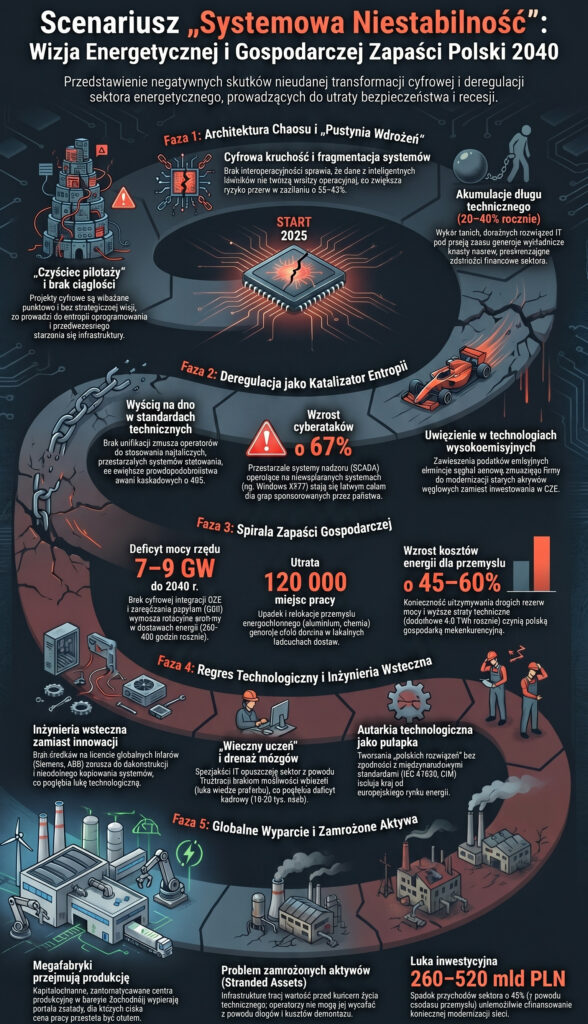
Infografiki dla obszaru strategicznego:
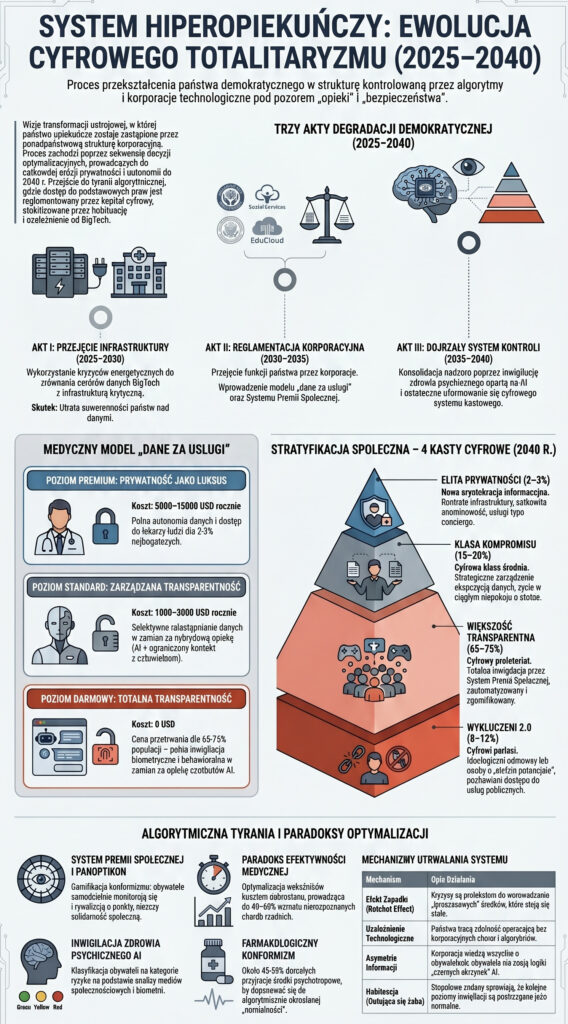
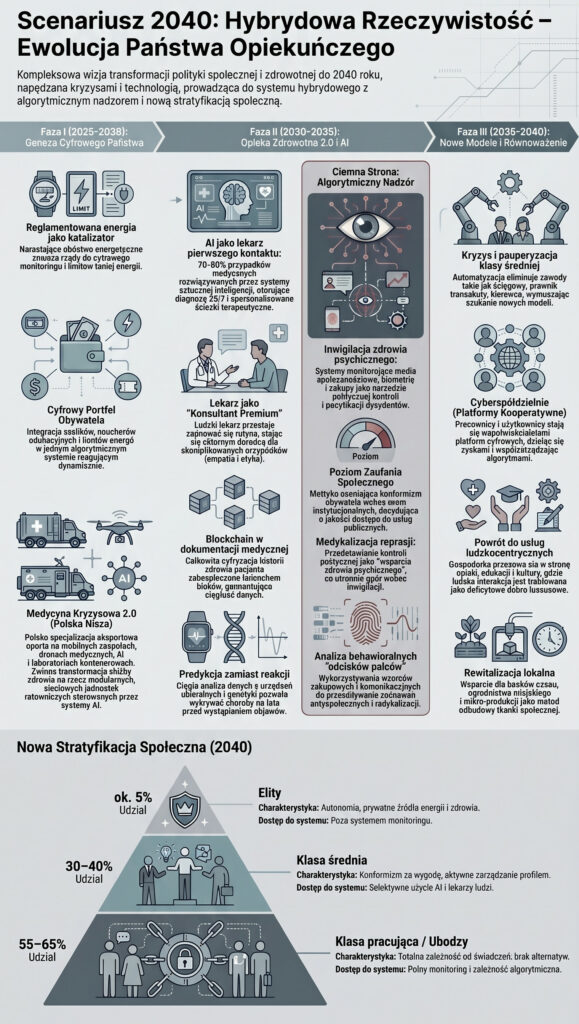
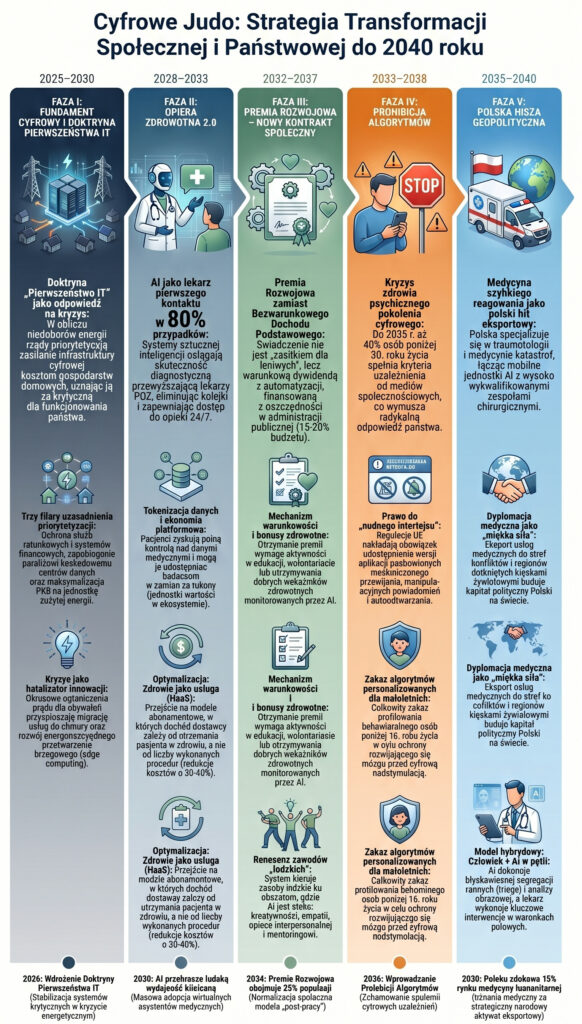
Polityka społeczna i zdrowotna
Infografiki dla obszaru strategicznego:
Economy and competitiveness of enterprises
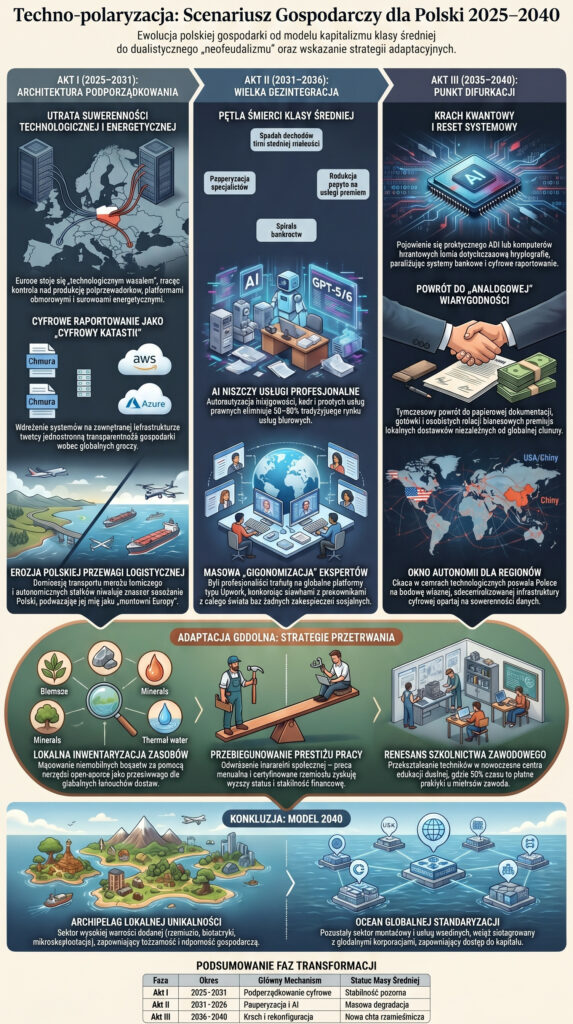
Infografiki dla obszaru strategicznego:
Internet and IT